맥OSX(Mac OSX)에서 리브레오피스(LibreOffice)를 빌드 후, 디버깅을 하려면 gdb대신 lldb를 이용해야 합니다.
맥에서 리브레오피스(LibreOffice) 빌드후, 새로운 아이디어가 생각이 나서 소스 수정 후 디버깅을 해보았습니다.
make debugrun
빌드를 하고 gdb로 디버깅을 하려고 했더니 어 gdb명령어가 안먹네??
확인결과, MacOSX에서는 llvm으로 빌드하기 때문에 gdb대신 lldb를 사용해야합니다.
https://wiki.documentfoundation.org/Development/How_to_debug#Debugging_with_lldb
How to debug - The Document Foundation Wiki
The Document Foundation Wiki Debugging options You need to enable debugging support to do any practical interactive debugging. You can enable it for the entire build with: ./autogen.sh --enable-debug or ./autogen.sh --enable-dbgutil If you have done a non-
wiki.documentfoundation.org
저는 대학교때 배운 gdb명령어로 디버깅을 하려고 했더니, lldb가 손에 익지 않아 시행착오를 많이 겪게 되네요
아래는 llvm을 밀고 있는 Apple사에서 제공하는 gdb와 lldb의 비교 링크입니다.
GDB and LLDB Command Examples
GDB and LLDB Command Examples The tables in this chapter list commonly used GDB commands and present equivalent LLDB commands and alternative forms. Also listed are the built-in GDB compatibility aliases in LLDB. Notice that full LLDB command names can be
developer.apple.com
아래는 참고할만한 lldb디버깅 기술 소개 링크입니다.
https://www.letmecompile.com/xcode-lldb-%EB%94%94%EB%B2%84%EA%B9%85-%ED%85%8C%ED%81%AC%EB%8B%89/
Xcode LLDB 디버깅 테크닉
Xcode에 기본으로 내장되어있는 디버거(debugger)인 LLDB는 기존에 가장 많이 사용되던 gdb보다 많은 유용한 기능들을 갖고있다. LLDB 명령어 분석기에는 파이썬(Python) 인터프리터가 내장되어있어서 scr
www.letmecompile.com
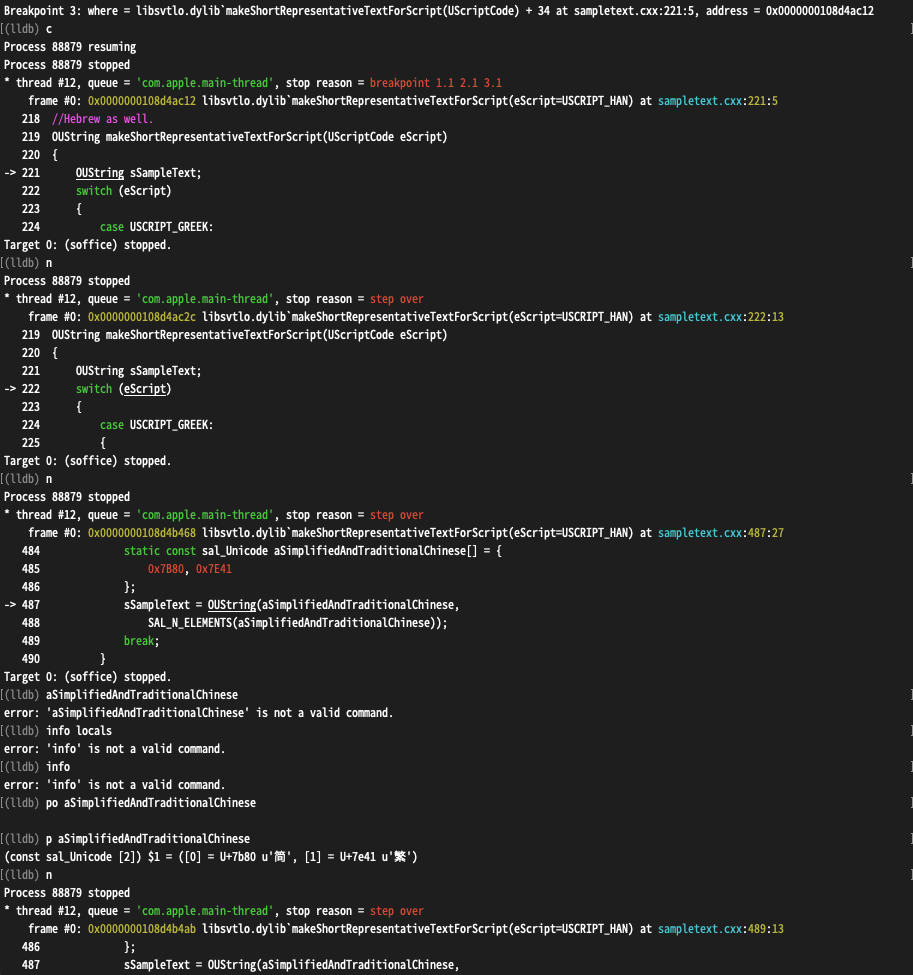
아래는 lldb로 디버깅(Debugging)중인 화면입니다.
ps. Apple사에서 제공하는 LLDB와 Xcode에 대한 글
About LLDB and Xcode
About LLDB and Xcode With the release of Xcode 5, the LLDB debugger becomes the foundation for the debugging experience on OS X. LLDB is Apple’s “from the ground up” replacement for GDB, developed in close coordination with the LLVM compilers to brin
developer.apple.com

